
Most Dangerous Intersections in California [NEW STUDY]
*As part of our commitment to consumer safety, the San Diego car accident attorneys at Estey & Bomberger present the first in our data-driven study series: Safety through Numbers. Each month, with the help of data visualization firm 1point21 interactive, we will take a look at a whole host of consumer safety issues to find out where danger lurks for Californians. Our first study examines dangerous intersections throughout the state.
What are the most dangerous intersections in California? Where are they located?
Together with data visualization company 1point21 Interactive, we analyzed over 435,000 collision records to find out which intersections in California are the most dangerous. In our effort, we examined every motor vehicle crash recorded by the Statewide Integrated Traffic Records System (SWITRS) in 2015. Taking total crashes, injuries and fatalities into account, we identified and ranked all intersections with 10 or more accidents. Based on this 2015 crash data, here are the most dangerous intersections in California:
Rankings
| Rank | City | Road 1 | Road 2 | Crashes | Deaths | Injuries | Score |
| #1 | LOS ANGELES | DEVONSHIRE ST | RESEDA BL | 24 | 0 | 41 | 147 |
| #2 | LOS ANGELES | IMPERIAL HWY | VISTA DEL MAR | 26 | 0 | 39 | 143 |
| #3 | LOS ANGELES | BALBOA BL | NORDHOFF ST | 26 | 0 | 37 | 137 |
| #4 | DOWNEY | FIRESTONE BL | LAKEWOOD BL | 36 | 0 | 32 | 132 |
| #5 | LOS ANGELES | LINDLEY AV | ROSCOE BL | 16 | 2 | 31 | 129 |
| #6 | LOS ANGELES | ROSCOE BL | WINNETKA AV | 25 | 1 | 31 | 128 |
| #7 | LOS ANGELES | ROSCOE BL | VAN NUYS BL | 30 | 0 | 32 | 126 |
| #8 | LOS ANGELES | RESEDA BL | ROSCOE BL | 23 | 0 | 33 | 122 |
| #9 | LOS ANGELES | SHERMAN WY | WOODMAN AV | 23 | 0 | 32 | 119 |
| #10 | MORENO VALLEY | BRIDGE ST | GILMAN SPRINGS RD | 24 | 3 | 21 | 117 |
| #11 | LOS ANGELES | VAN NUYS BL | VICTORY BL | 23 | 0 | 30 | 113 |
| #12 | RIVERSIDE | MAGNOLIA AV | TYLER ST | 24 | 1 | 26 | 112 |
| #13 | LOS ANGELES | LENNOX AV | ROSCOE BL | 17 | 1 | 28 | 111 |
| #14 | LOS ANGELES | VICTORY BL | WOODLEY AV | 18 | 0 | 30 | 108 |
| #15 | LOS ANGELES | SAINT ANDREWS PL | VENICE BL | 14 | 0 | 31 | 107 |
| #16 | LOS ANGELES | DE SOTO AV | SATICOY ST | 19 | 1 | 25 | 104 |
| #17 | LOS ANGELES | RESEDA BL | VICTORY BL | 22 | 0 | 27 | 103 |
| #18 | LOS ANGELES | OXNARD ST | VAN NUYS BL | 19 | 0 | 28 | 103 |
| #19 | LOS ANGELES | LA CIENEGA BL | PICO BL | 24 | 0 | 26 | 102 |
| #20 | LOS ANGELES | ALVARADO ST | TEMPLE ST | 21 | 0 | 27 | 102 |
| #21 | LOS ANGELES | BALBOA BL | DEVONSHIRE ST | 20 | 0 | 27 | 101 |
| #22 | BELL | FLORENCE AV | WALKER AV | 19 | 1 | 24 | 101 |
| #23 | LOS ANGELES | KESTER AV | VANOWEN ST | 17 | 0 | 28 | 101 |
| #24 | PALA | PALA MISSION RD | PALA TEMECULA RD | 34 | 0 | 22 | 100 |
| #25 | LOS ANGELES | NORDHOFF ST | SEPULVEDA BL | 27 | 1 | 21 | 100 |
| #26 | LOS ANGELES | MAIN ST | MANCHESTER AV | 19 | 0 | 27 | 100 |
| #27 | LOS ANGELES | CENTRAL AV | VERNON AV | 24 | 0 | 25 | 99 |
| #28 | TEMECULA | WINCHESTER RD | YNEZ RD | 23 | 0 | 25 | 98 |
| #29 | LAKESIDE | OLD BARONA RD | WILDCAT CANYON RD | 17 | 2 | 20 | 97 |
| #30 | RIALTO | BASELINE RD | RIVERSIDE AV | 16 | 0 | 27 | 97 |
| #31 | LOS ANGELES | FIGUEROA ST | MANCHESTER AV | 24 | 0 | 24 | 96 |
| #32 | LOS ANGELES | BALBOA BL | SATICOY ST | 21 | 0 | 25 | 96 |
| #33 | LOS ANGELES | LA BREA AV | RODEO RD | 20 | 0 | 25 | 95 |
| #34 | LOS ANGELES | CRENSHAW BL | WASHINGTON BL | 27 | 1 | 19 | 94 |
| #35 | LOS ANGELES | 3RD ST | FAIRFAX AV | 22 | 0 | 24 | 94 |
| #36 | LOS ANGELES | FLORENCE AV | VERMONT AV | 16 | 0 | 26 | 94 |
| #37 | LOS ANGELES | 190TH ST | VERMONT AV | 21 | 0 | 24 | 93 |
| #38 | WESTMINSTER | BOLSA AV | BROOKHURST ST | 20 | 1 | 21 | 93 |
| #39 | LOS ANGELES | BEVERLY BL | VERMONT AV | 18 | 0 | 25 | 93 |
| #40 | LOS ANGELES | NORDHOFF ST | RESEDA BL | 18 | 0 | 25 | 93 |
| #41 | LOS ANGELES | NORMANDIE AV | SLAUSON AV | 13 | 2 | 20 | 93 |
| #42 | LANCASTER | CHALLENGER WY | LANCASTER BL | 12 | 0 | 27 | 93 |
| #43 | LOS ANGELES | BALBOA BL | BURBANK BL | 23 | 0 | 23 | 92 |
| #44 | FULLERTON | EUCLID ST | ORANGETHORPE AV | 25 | 0 | 22 | 91 |
| #45 | ELK GROVE | CALVINE RD | ELK GROVE FLORIN RD | 19 | 0 | 24 | 91 |
| #46 | LOS ANGELES | VICTORY BL | WINNETKA AV | 16 | 0 | 25 | 91 |
| #47 | SACRAMENTO | LOS ROBLES BL | MARYSVILLE BL | 15 | 1 | 22 | 91 |
| #48 | FAIRFIELD | AIR BASE PKWY | CLAY BANK RD | 20 | 1 | 20 | 90 |
| #49 | LOS ANGELES | CENTRAL AV | EL SEGUNDO BL | 19 | 2 | 17 | 90 |
| #50 | PALMDALE | PEARBLOSSOM HWY | SIERRA HWY | 18 | 3 | 14 | 90 |
| #51 | SANTA ANA | BRISTOL ST | WARNER AV | 17 | 0 | 24 | 89 |
| #52 | LOS ANGELES | MELROSE AV | VERMONT AV | 14 | 0 | 25 | 89 |
| #53 | LOS ANGELES | WESTHOLME AV | WILSHIRE BL | 11 | 0 | 26 | 89 |
| #54 | SANTA CLARITA | SIERRA HWY | SOLEDAD CANYON RD | 40 | 0 | 16 | 88 |
| #55 | REDWOOD CITY | MIDDLEFIELD RD | WOODSIDE RD | 25 | 0 | 21 | 88 |
| #56 | LOS ANGELES | NORDHOFF ST | VAN NUYS BL | 18 | 0 | 23 | 87 |
| #57 | PARAMOUNT | GARFIELD AV | ROSECRANS AV | 44 | 0 | 14 | 86 |
| #58 | LOS ANGELES | SLAUSON AV | WESTERN AV | 29 | 0 | 19 | 86 |
| #59 | LOS ANGELES | FLORENCE AV | WESTERN AV | 23 | 0 | 21 | 86 |
| #60 | SIMI VALLEY | COCHRAN ST | ERRINGER RD | 20 | 0 | 22 | 86 |
| #61 | CARSON | 213TH ST | AVALON BL | 22 | 0 | 21 | 85 |
| #62 | PALMDALE | RANCHO VISTA BL | SIERRA HWY | 22 | 0 | 21 | 85 |
| #63 | LOS ANGELES | BROADWAY | FLORENCE AV | 19 | 0 | 22 | 85 |
| #64 | LOS ANGELES | SUNSET BL | WESTERN AV | 19 | 0 | 22 | 85 |
| #65 | LOS ANGELES | FLORENCE AV | NORMANDIE AV | 21 | 0 | 21 | 84 |
| #66 | LOS ANGELES | BRAND BL | LAUREL CANYON BL | 12 | 0 | 24 | 84 |
| #67 | LOS ANGELES | CORBIN AV | SATICOY ST | 12 | 0 | 24 | 84 |
| #68 | LOS ANGELES | 3RD ST | VERMONT AV | 23 | 0 | 20 | 83 |
| #69 | SAN JACINTO | RAMONA EXPWY | SANDERSON AV | 23 | 0 | 20 | 83 |
| #70 | FULLERTON | HARBOR BL | ORANGETHORPE AV | 20 | 0 | 21 | 83 |
| #71 | DOWNEY | FLORENCE AV | LAKEWOOD BL | 17 | 0 | 22 | 83 |
| #72 | SACRAMENTO | 28TH ST | FRUITRIDGE RD | 14 | 0 | 23 | 83 |
| #73 | UPLAND | 16TH ST | CAMPUS AV | 14 | 0 | 23 | 83 |
| #74 | UPLAND | FOOTHILL BL | SAN ANTONIO AV | 14 | 0 | 23 | 83 |
| #75 | LOS ANGELES | BALBOA BL | ROSCOE BL | 19 | 0 | 21 | 82 |
| #76 | LOS ANGELES | ROSCOE BL | TAMPA AV | 19 | 0 | 21 | 82 |
| #77 | DOWNEY | FLORENCE AV | OLD RIVER SCHOOL RD | 16 | 0 | 22 | 82 |
| #78 | LOS ANGELES | 8TH ST | HOOVER ST | 16 | 0 | 22 | 82 |
| #79 | LOS ANGELES | ADAMS BL | LA BREA AV | 16 | 0 | 22 | 82 |
| #80 | LOS ANGELES | COLDWATER CANYON AV | SHERMAN WY | 13 | 0 | 23 | 82 |
| #81 | CHINO | EUCLID AV | PINE AV | 24 | 0 | 19 | 81 |
| #82 | HESPERIA | COTTONWOOD AV | MAIN ST | 21 | 0 | 20 | 81 |
| #83 | LOS ANGELES | BALBOA BL | RINALDI ST | 18 | 0 | 21 | 81 |
| #84 | LOS ANGELES | CRENSHAW BL | PICO BL | 18 | 0 | 21 | 81 |
| #85 | LOS ANGELES | HAZELTINE AV | RIVERSIDE DR | 15 | 0 | 22 | 81 |
| #86 | SACRAMENTO | JESSIE AV | NORWOOD AV | 15 | 0 | 22 | 81 |
| #87 | LOS ANGELES | HASKELL AV | ROSCOE BL | 12 | 3 | 13 | 81 |
| #88 | LOS ANGELES | HOOVER ST | MANCHESTER AV | 12 | 0 | 23 | 81 |
| #89 | LOS ANGELES | VICTORY BL | WOODMAN AV | 20 | 0 | 20 | 80 |
| #90 | LOS ANGELES | CANOGA AV | VANOWEN ST | 14 | 0 | 22 | 80 |
| #91 | LOS ANGELES | MANCHESTER AV | NORMANDIE AV | 14 | 0 | 22 | 80 |
| #92 | LOS ANGELES | ETHEL AV | VICTORY BL | 11 | 0 | 23 | 80 |
| #93 | LOS ANGELES | FAIRFAX AV | OLYMPIC BL | 16 | 0 | 21 | 79 |
| #94 | NORWALK | IMPERIAL HWY | JERSEY AV | 30 | 0 | 16 | 78 |
| #95 | LOS ANGELES | VENICE BL | WESTERN AV | 18 | 0 | 20 | 78 |
| #96 | HEMET | FLORIDA AV | KIRBY ST | 15 | 0 | 21 | 78 |
| #97 | LOS ANGELES | CORBIN AV | VICTORY BL | 15 | 0 | 21 | 78 |
| #98 | LOS ANGELES | LINDLEY AV | VICTORY BL | 15 | 0 | 21 | 78 |
| #99 | LOS ANGELES | CHATSWORTH ST | RESEDA BL | 12 | 0 | 22 | 78 |
| #100 | LOS ANGELES | IMPERIAL HWY | WESTERN AV | 20 | 0 | 19 | 77 |
*Intersections with higher scores are more dangerous than those with lower scores. For more information on the scoring system, see our methodology below.
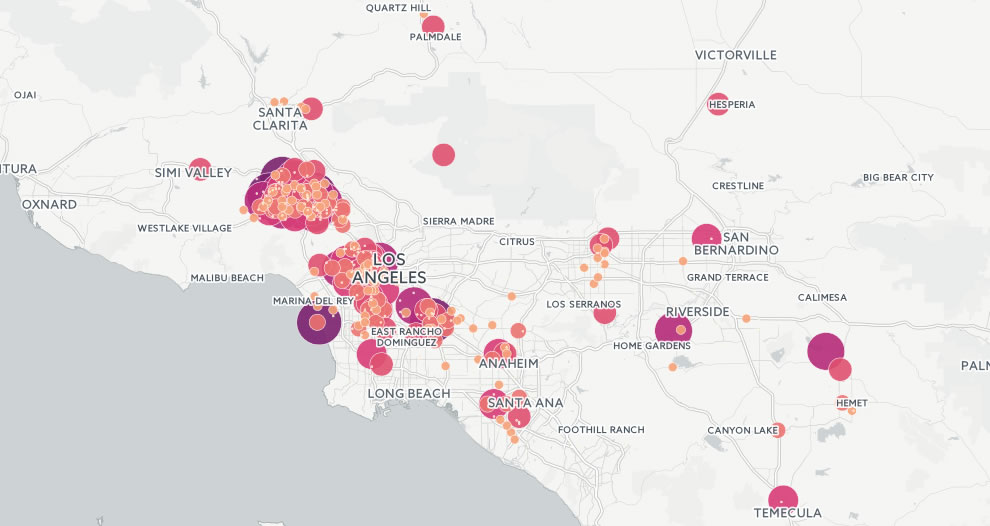
Interactive Map
Zoom in on any area of the map. Larger circles represent a more dangerous intersection. Hover over any circle to see the cross streets and the danger score of that intersection.
Key Findings
- In 2015, there were 7,294 crashes, 7,478 injuries and 57 fatalities at the 444 intersections in our study.
- The average danger score of a dangerous intersection was 68.24
- The average number of accidents per dangerous intersection was 16.43
- The average number of injuries per dangerous intersection was 16.84
- The average number of deaths per dangerous intersection was 0.128
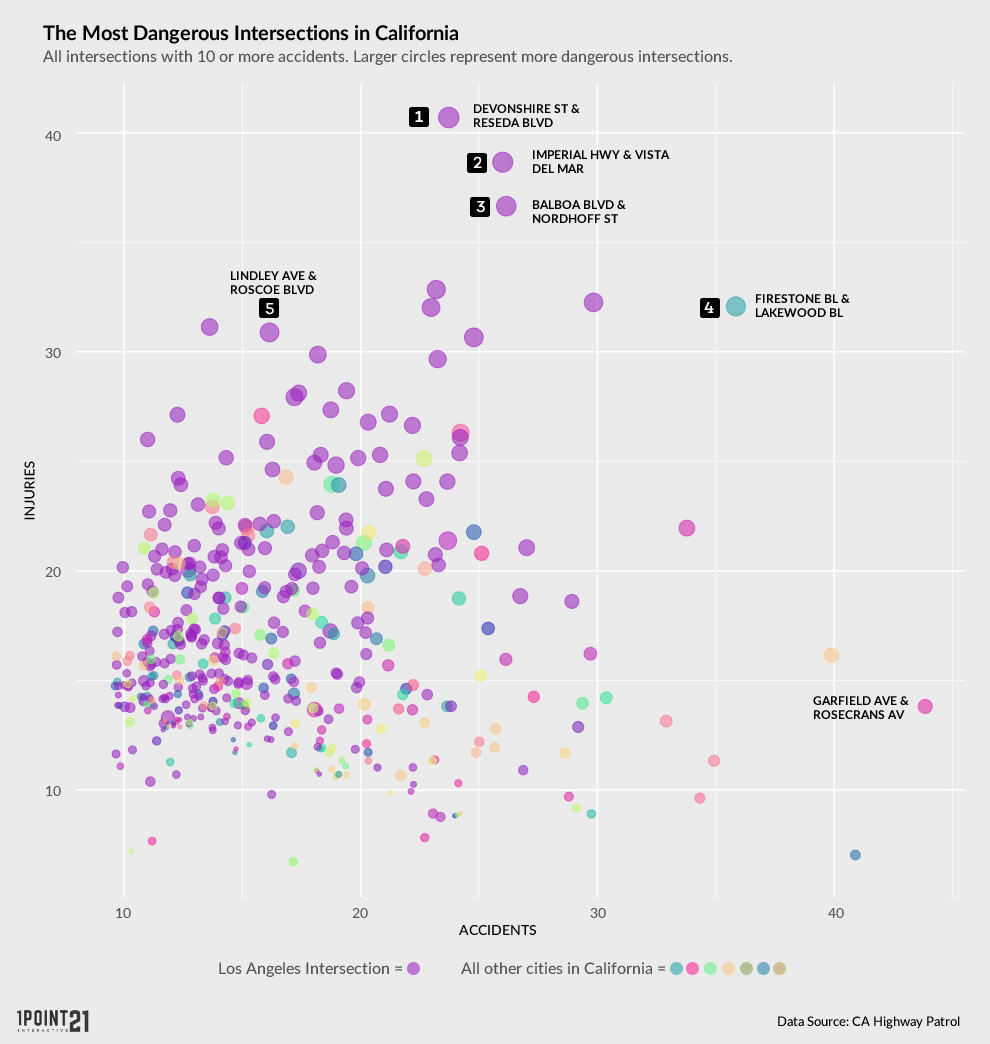
- The intersection of Devonshire Street and Reseda Boulevard is the most dangerous intersection in California, followed closely by Imperial Highway and Vista Del Mar then Balboa Avenue and Nordhoff Street.
- In a state with over 76,000 miles of city streets and another 65,000 miles of county roads, two of the three most dangerous intersections – Devonshire Street and Reseda Boulevard (#1) and Balboa Avenue and Nordhoff Street (#3) -are located in the Northridge neighborhood of Los Angeles, just 3.4 miles apart.
- Devonshire and Reseda was the site of the most injuries (41) while Garfield Avenue and Rosecrans Avenue had the highest volume of crashes (44).
- Southern California dominates the study. In fact, only 47 of the intersections in our study (10.5 percent) are located anywhere outside of southern California.
- City-wise, it’s Los Angeles, then everyone else. 221 of the 444 intersections are on Los Angeles streets.
Distribution of Dangerous Intersections
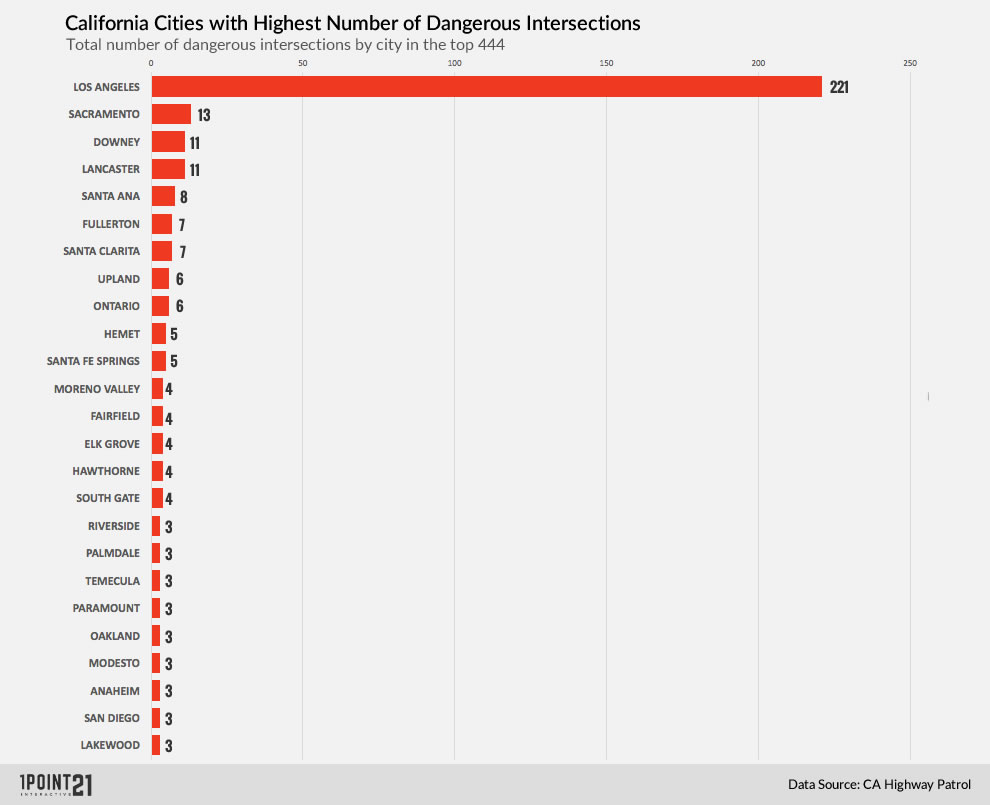
It comes as no surprise that Los Angeles led the way in terms of accident volume, injuries and the number of dangerous intersections. What is surprising, however, is by how much it led the way. Almost half of the intersections in our study (221 of 444) are located within the city of Los Angeles boundaries. What’s more, 8 of the 10 most dangerous intersections and 17 of the top 20, are also found in L.A. The chart below plots all the dangerous intersections identified in our study. Purple dots (representing an intersection in the city of Los Angeles) dominate the data visualization below.
Los Angeles has 17 times as many intersections from our list than the number two city on the the list, Sacramento. While the Los Angeles metropolitan area is the most densely populated urban area in the United States (classified as Los Angeles – Long Beach – Anaheim by the U.S. Census), six other areas in California are among the top ten.
Why We Did This
Safety on our roads is the responsibility of those using the roads, but also on those that design and maintain our roads. This study identifies trends and dangers that our local government and community can use in improving safety and lowering the risks of serious injury. Proactively approaching the threats of dangerous intersections can save lives — that is what we hoped to accomplish with this study.
Methodology
We parsed over 435,000 collision records for 2015, separating all accidents that occurred at intersections. We then assigned values to each accident, injury and fatality at each intersection to calculate a score to rate the danger of the intersection.
Formula: Accident (x1) + Injury (x3) + Fatality (x10) = Overall Score
Collision data obtained from SWITRS (a multi-agency database maintained by the California Highway Patrol).